- Documentation
- Dashboard
Documentation Quick Links
Dashboard
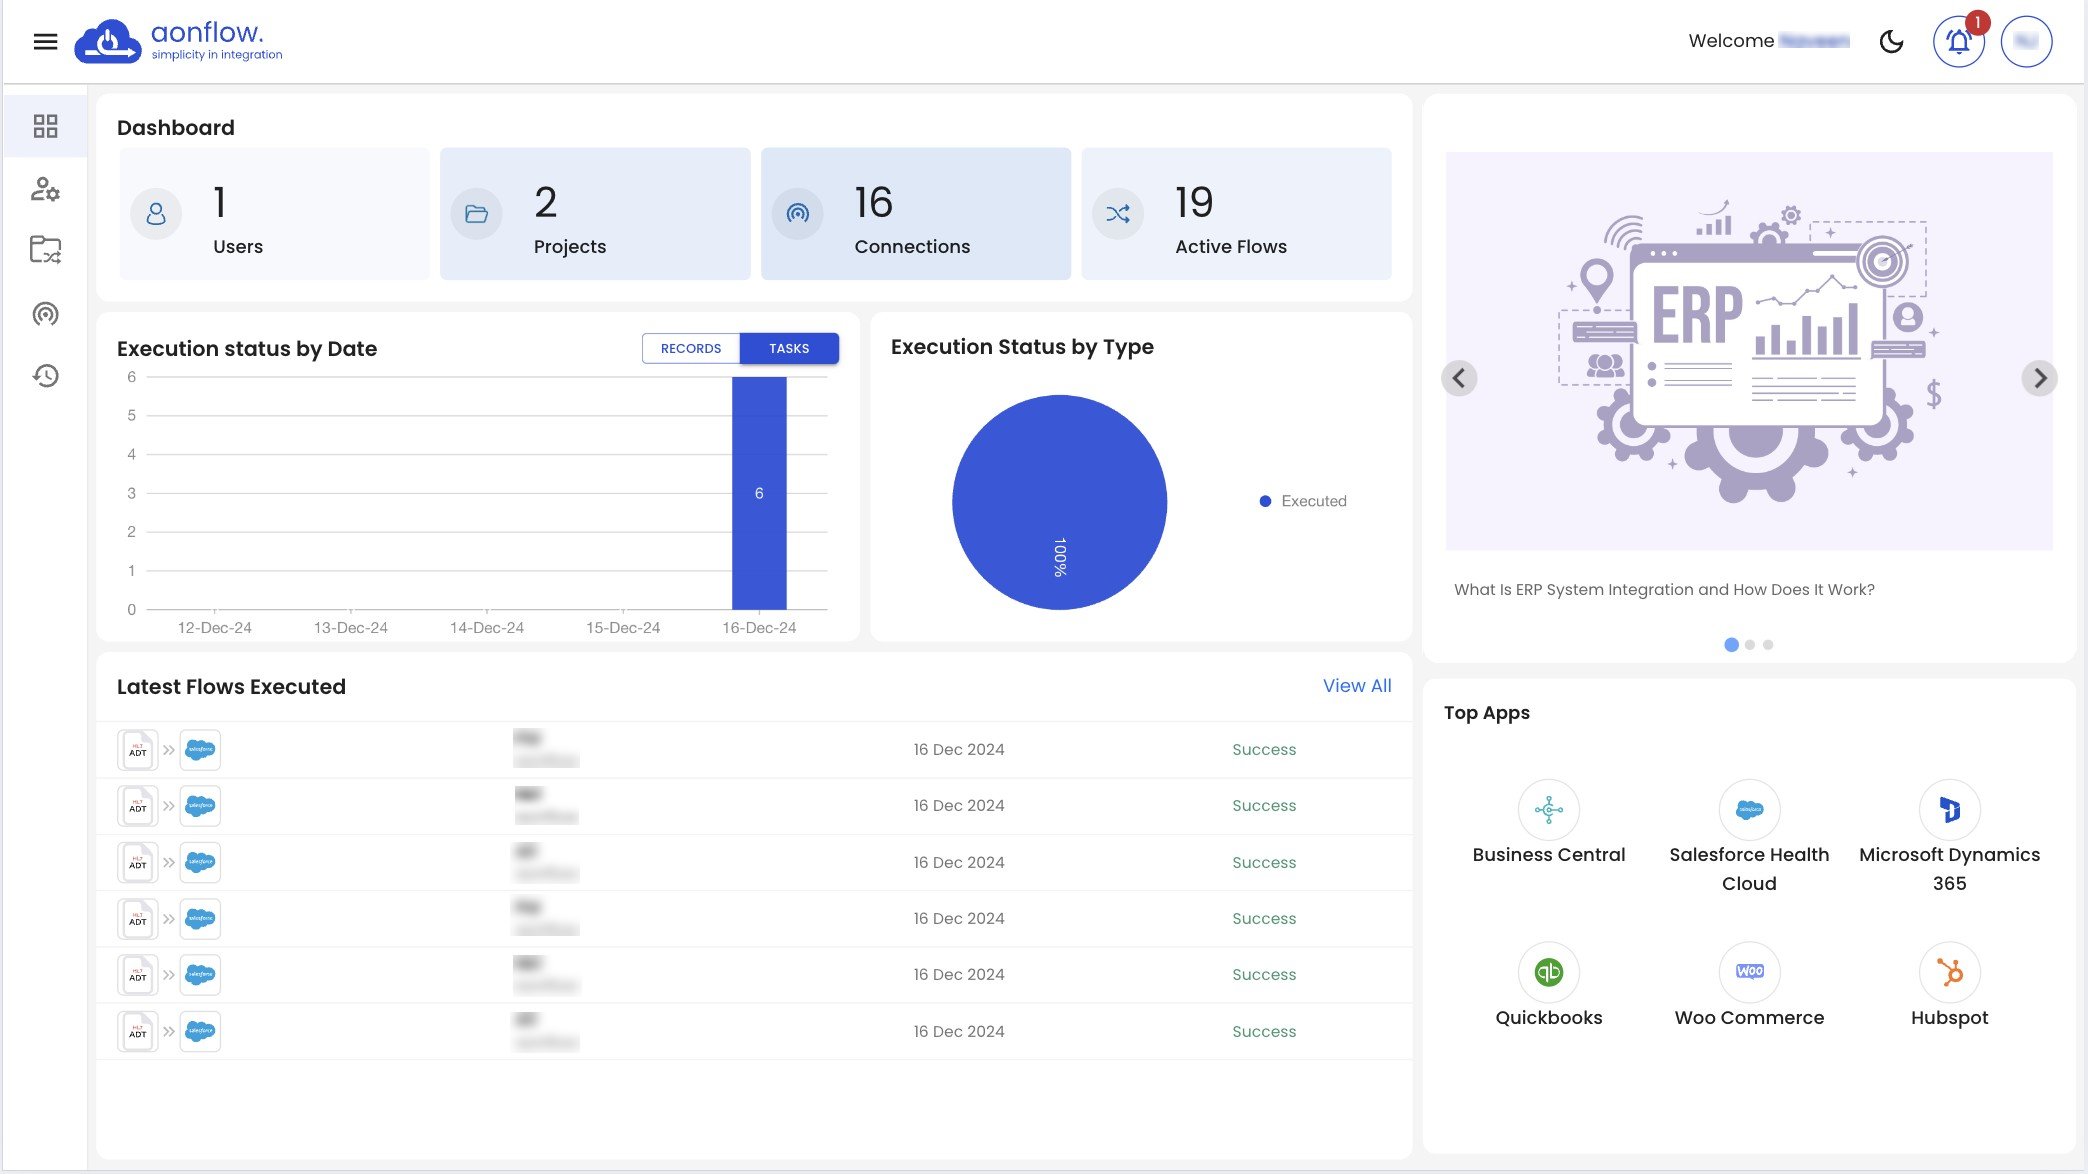
Here’s a break-up of the Dashboard:
Left Panel
Click on the top-left ‘Menu Bar’ as seen in the image below.
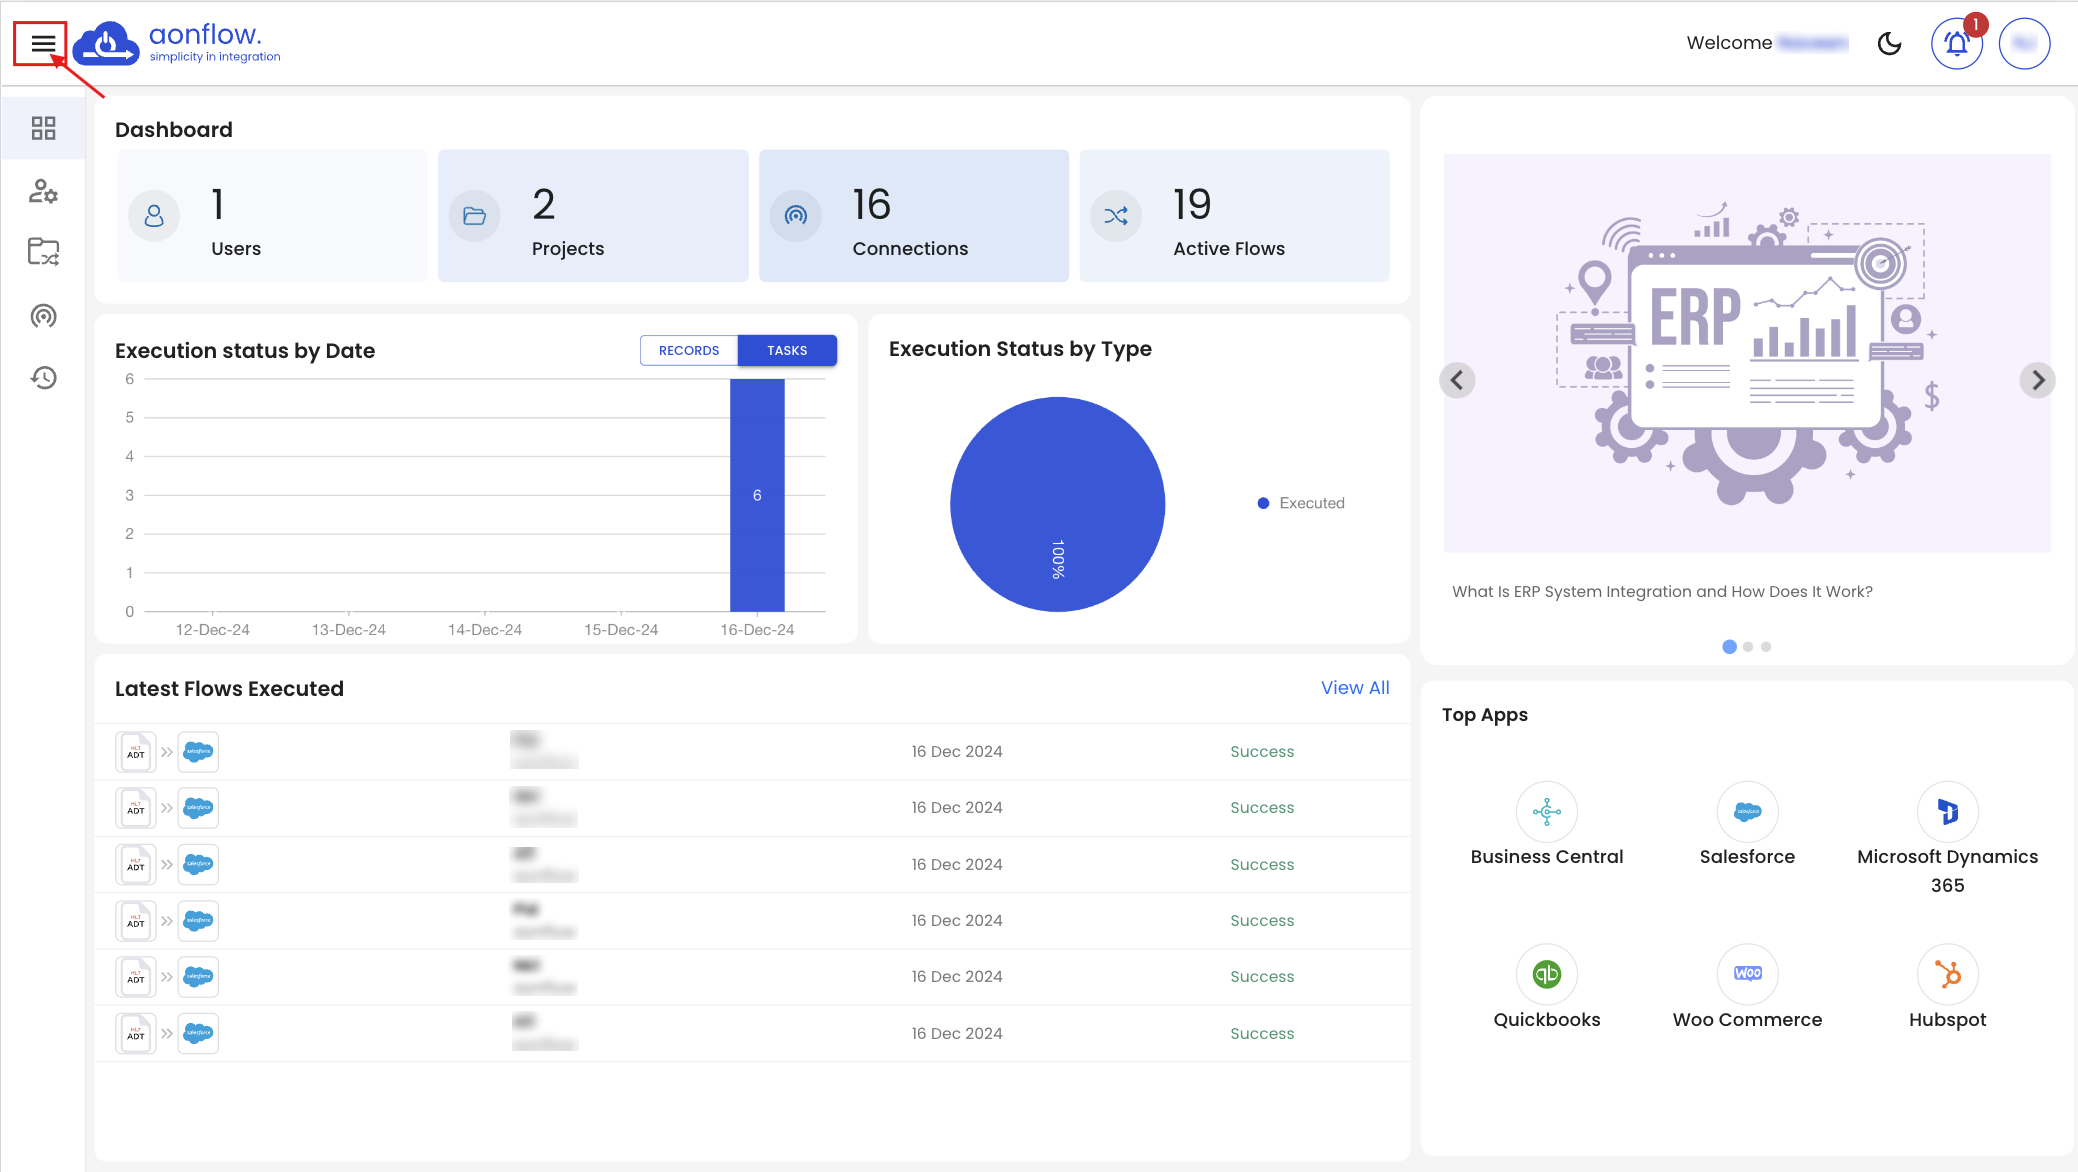
Once the Left Panel Menu Bar opens up, you will see these segments:
- DASHBOARD
- USER MANAGEMENT
- PROJECTS
- CONNECTIONS
- FLOW RUN HISTORY
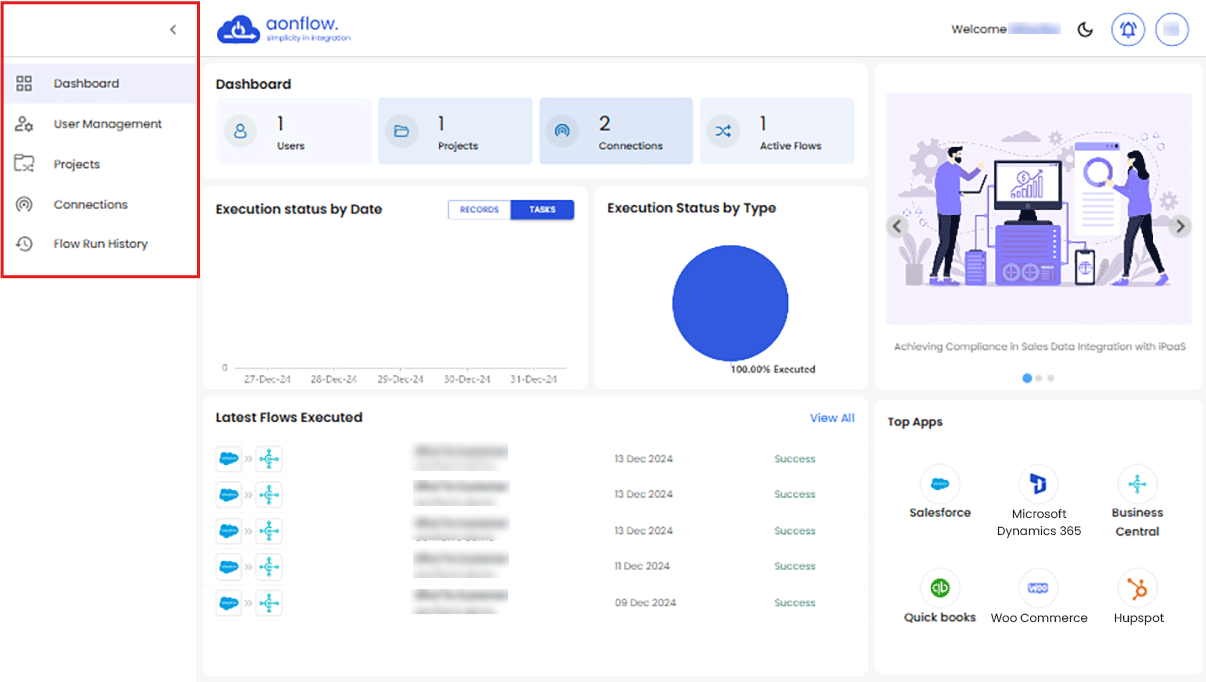
Now, let’s look at the SEGMENTS on the left panel of the DASHBOARD.
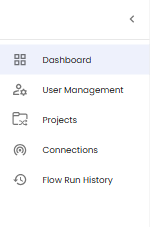

This is the “Home” icon. Click on it if you want to come back to the main Home Dashboard.

This is the “User Management” icon. Click on it to view the “USER DETAILS,” “INVITE USERS” and “REQUESTS”

This is the “Projects” icon. Click on it to create new projects or view existing projects.

This is the “Connections” icon. Click on it to create new connections or view existing connections.

This is the “Flow Run History” icon. Click on it to view the history of flows that have been executed.
Insights
In this area, you can view the Active organization's number of “Active Users,” “Active Flows,” “Active Projects,” and “Active Connections”.

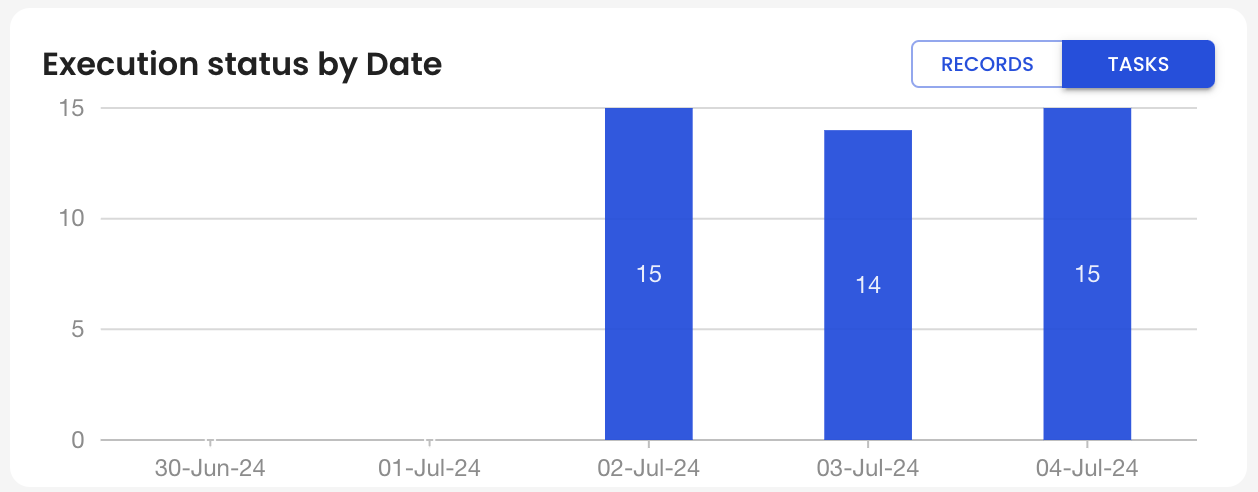
Execution Status by Date
Here, you can view a graphical representation of your flow execution status as per date. You can view the no. of records executed and the no. of tasks created.
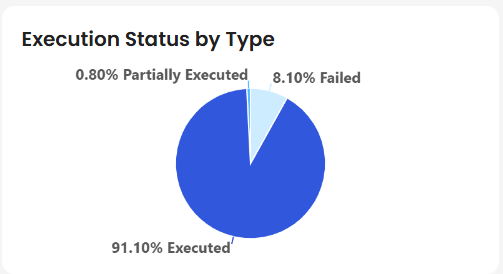
Execution Status by Type
Here, you can view the flow execution status as per its status type.
- % of successfully executed flows
- % of partially successful executed flows
- % of flows that failed to execute
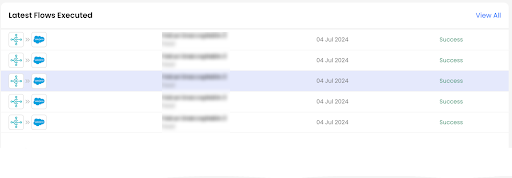
Latest Flows Executed
Here, you can view the latest flows that were executed.
Blogs Section
Here, you can view the blogs posted. If you want to read the blog, click on it and you will be redirected to the blogs page.

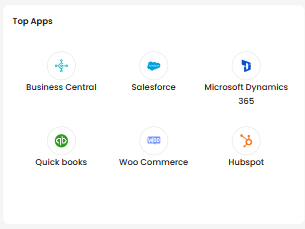
Top Apps
Here, you can view the list of “Top Apps” that can be integrated, synced, and connected.
Dark & Light Mode
Click on the moon icon to switch from light mode to the Dark mode.
Click on the sun icon to switch from Dark mode to Light mode.
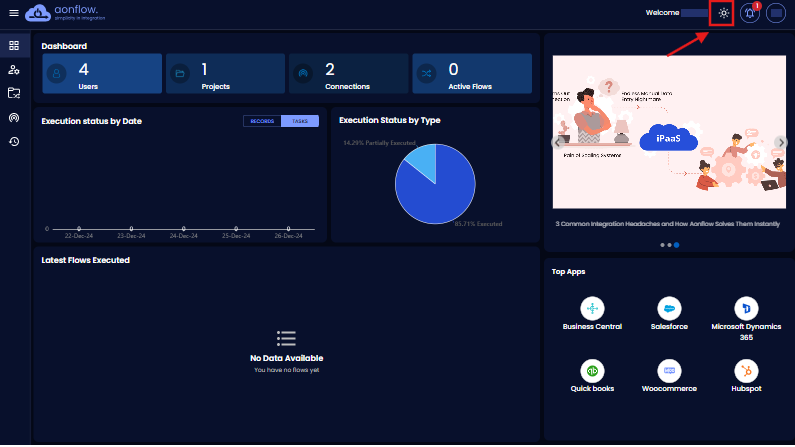
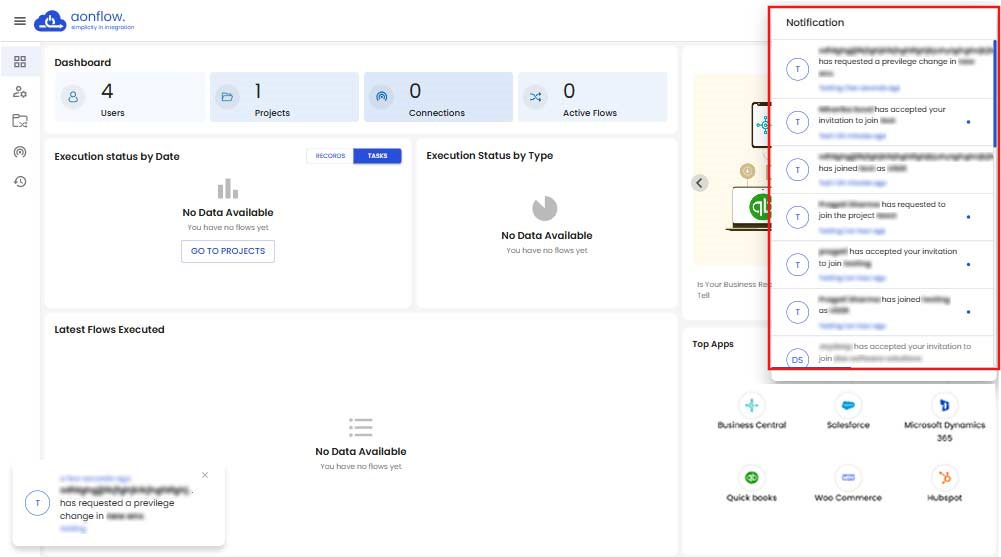
Notifications dropdown
Click on the bell icon to view the list of notifications received. Click on any of the notifications to take action on the notification.
FREE DEMO
Don't miss out! Schedule your free demo today.
Our experts will analyze your iPaaS requirements, not just show you the product.
Book a Demo